
Top 5 Project-Based Business Reports in QuickBooks Online
Profitability by Project | Track What Really Counts
If you run your business around projects, you need more than just a P&L.
Standard financial reports tell you how your business is doing overall—but if you’re working on jobs or contracts that stretch over days, weeks, or months, they don’t tell you the whole story.
Table of Contents
ToggleThat’s where project-based business reports come in. These reports give you insight into the profitability, timing, and health of your projects—not just your business as a whole.
If your business runs on projects—whether in contracting, creative work, or consulting—tracking performance at the project level is key to protecting your profit.
The reports below are considered “essential” for project-based businesses. While QuickBooks Online (QBO) Plus and Advanced include built-in Projects features, not every report on this list exists in QBO out of the box. For some, you’ll need to use filters, create custom reports or use third-party tools.
The goal here is to show you what to track, why it matters, and how you can get the data you need—whether directly in QBO or with a little extra setup.
Let’s explore the project-based business reports you should be reviewing regularly to stay profitable and in control.
Why Project-Based Business Reports Matter
Projects don’t follow a neat monthly calendar. Invoices might go out long after the work is done. Materials or subcontractors might be paid upfront. You might spend 80% of your effort in the first half—and not get paid until the end.
This kind of uneven workflow can cause confusion in your standard reports. That’s why tracking financials at the project level is critical.
Project-based business reports help you:
- Know which jobs are profitable (and which aren’t)
- See how profitable your projects really are—not just what you estimate
- Forecast cash flow gaps during long or delayed projects
- Make smarter bids or proposals based on real data
- Spot scope creep before it kills your margin
Without these reports, it’s easy to be busy all month and still wonder, “Where did the money go?”
QuickBooks Online Project Detail Screen
Before diving into the reports, it helps to know where to find them. The Project Detail screen in QuickBooks Online is your central hub for tracking everything tied to a project. From here, you can view transactions, run key project reports, and monitor progress all in one place. Think of it as your project’s control panel — and the starting point for the four reports we’ll cover next.
To get to the Project Detail screen:
From the left menu in QuickBooks Online, select Projects.
You’ll see a list of all your active projects.
Click on the project name you want to review.
This opens the Project Detail screen, where you’ll find the Transactions tab, project reports, and key insights.
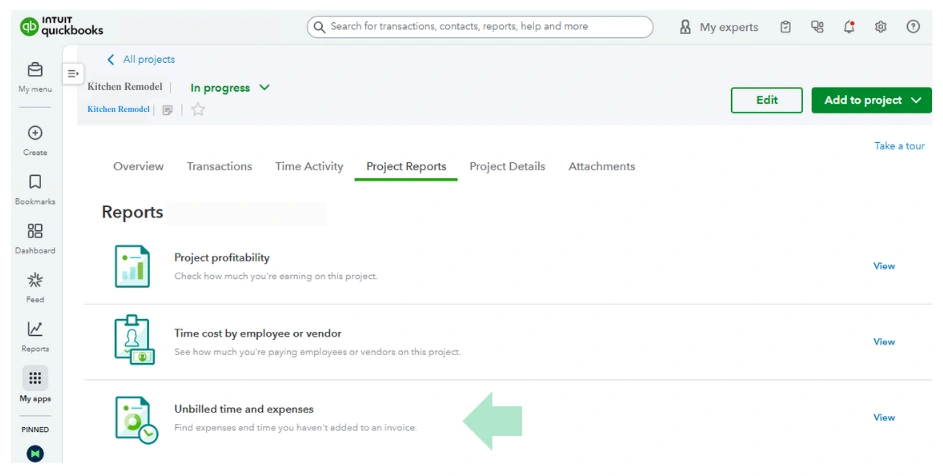
From the Project Detail Screen, you can access reports by clicking the Project Reports tab. Here you will find the project profitability report, time cost by employee or vendor report, and unbilled time and expenses report.
Project-Based Business Reports That Matter Most
Here are the main reports that can truly transform how you run and evaluate your projects:
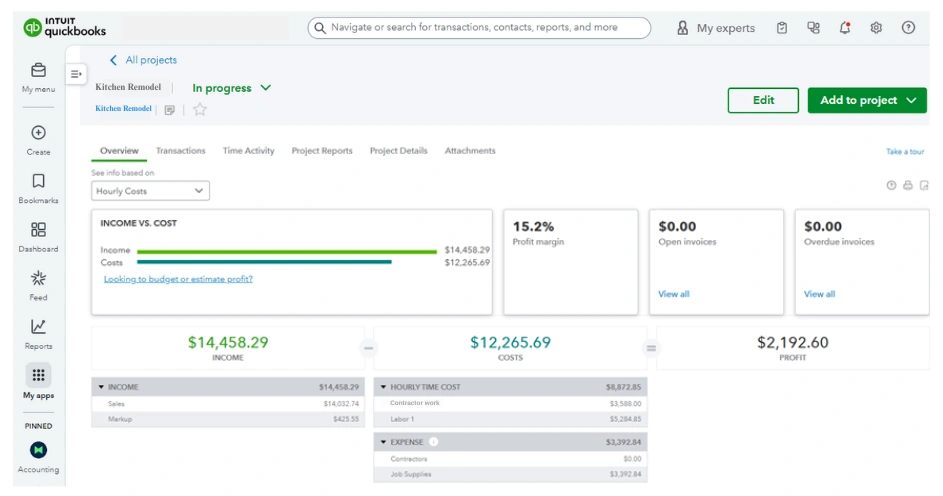
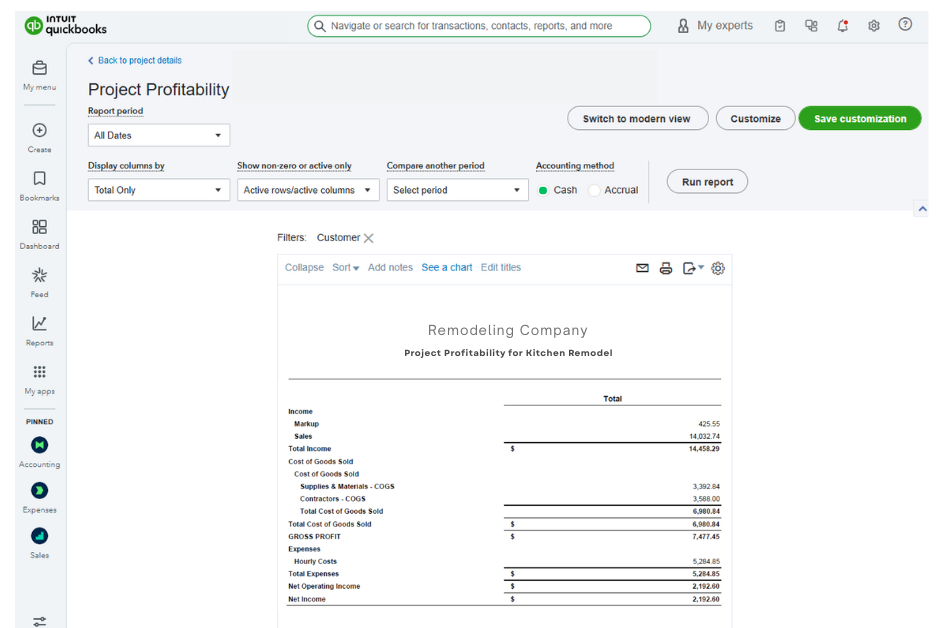
1. Project Profitability Report
Also known as: Job Profitability Summary
This is the holy grail of project-based business reports. It compares revenue, direct costs, and gross profit for each individual job or contract.
What It Shows:
- Total income per project
- Direct costs (labor, materials, subcontractors)
- Gross profit and margin
- Actual net profit
Why It Matters:
This is where you find out whether a project made money—or quietly cost you. It helps you answer:
- Are we underpricing this type of work?
- Did we underestimate time, materials, or labor?
- Should we change our approach or rates?
✅ Available in QBO Plus/Advanced under Projects > select project > “Project Reports” > Project Profitability.
Tip: Run this report at the end of every project, or monthly for longer projects.
2. Time Cost by Employee and Vendor
The Time Cost by Employee and Vendor report gives you a clear view of how labor and contractor expenses are adding up on your project, so you know exactly where your money is going.
What It Shows:
This report breaks down the labor costs for each employee and vendor assigned to your project. It includes billable time, hourly rates, and total costs, so you can see exactly how much each person or contractor is contributing to the project’s expenses.
Why It Matters:
Labor is often one of the biggest costs in project-based work. By seeing who is driving the most cost, you can spot budget overruns early, identify high-cost contributors, and make sure your team’s time is being billed and recovered appropriately.
✅ This report pulls directly from time entries and vendor bills connected to the project, giving you a reliable view of labor costs without extra data entry.
Tracking employee and vendor costs can take a little setup at first. This QuickBooks video from Intuit shows how to add labor costs to a project.
Tip: Compare this report with your project estimates to ensure your labor costs are tracking as expected. If you see consistent gaps, it may be time to revisit your pricing or how you scope labor in future projects.
3. Unbilled Time and Expenses Report
The Unbilled Time and Expenses report highlights any project work or costs you haven’t invoiced yet, making sure no billable items slip through the cracks.
What It Shows:
This report lists all time entries, expenses, bills, and other billable costs assigned to a project that haven’t yet been invoiced to the client.
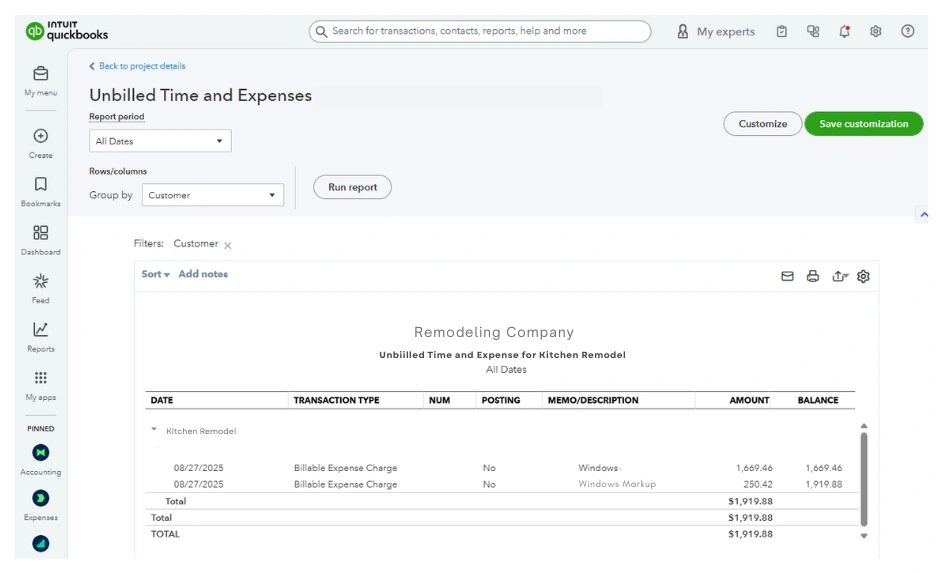
Why It Matters:
Unbilled items are essentially money left on the table. If you don’t track them, you risk doing the work, covering the costs, and never recovering the cash. Reviewing this report regularly helps ensure every hour worked and every expense incurred makes it onto an invoice.
✅ QuickBooks Online pulls this report directly from project time entries and billable expenses, giving you a reliable catch-all for anything not yet billed.
Tip: Run this report before closing out a project or sending the next round of invoices — it’s the easiest way to make sure nothing slips through unnoticed.
4. Cash Flow by Project
In addition to the three built-in reports we just reviewed, the Project Detail screen offers even more insights you can tap into.
When it comes to project cash flow, what really matters is knowing whether money is coming in on time and whether payments are going out as expected. QuickBooks Online doesn’t have a one-click “Cash Flow by Project” report, but you can easily piece together the insights that matter most by focusing on three checkpoints:
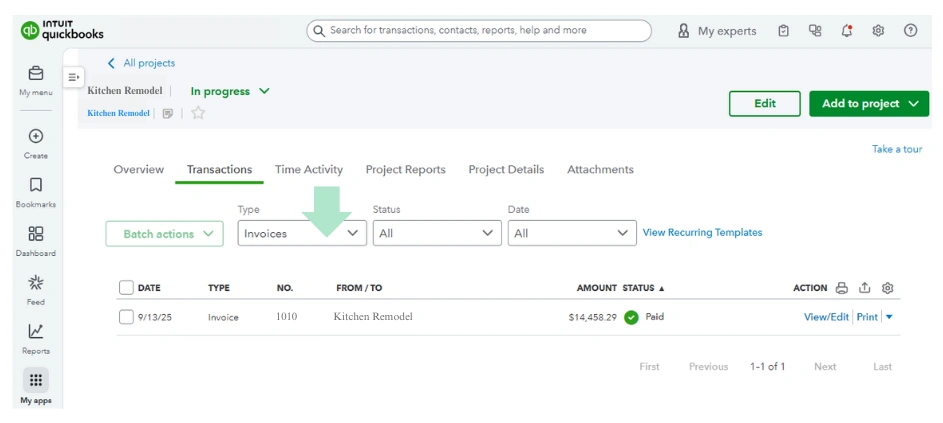
Have your invoices been paid?
From the project’s Transactions tab, filter by Invoices to quickly see which ones are still open and which ones have been paid. This tells you if cash is actually flowing in.
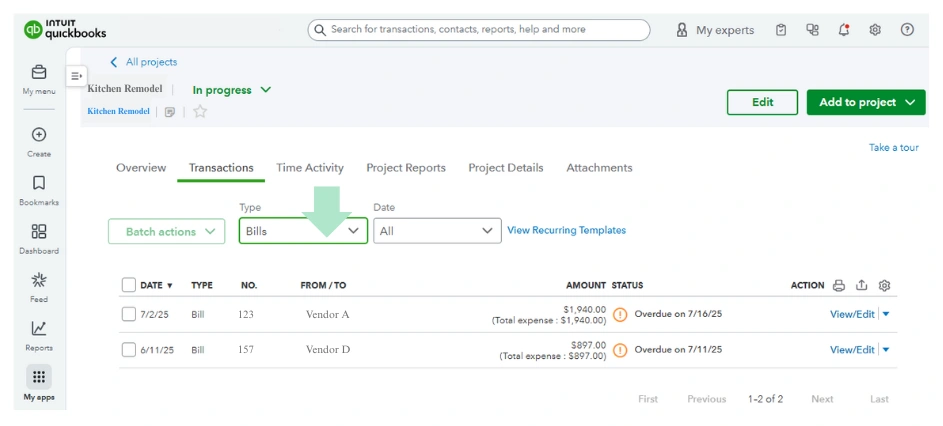
- Are there any unpaid bills?
Still in the project’s Transactions tab, filter by Bills. Overdue bills show you what cash is about to flow out — and can alert you to upcoming cash shortages.
Is there anything left to bill?
Run the Unbilled Time and Expenses report from the Project Reports section. This shows if you’ve completed work or incurred costs that you haven’t invoiced yet — essentially cash that’s waiting for you to collect.
Why It Matters:
In project work, cash doesn’t always move in sync with progress. You might receive a deposit early and see your cash balance drop as expenses pile up, or you might cover material costs weeks before client payments arrive. Keeping an eye on what’s been paid, what’s still owed, and what’s waiting to be billed helps you avoid surprises and ensures you have the cash to keep the project moving.
✅ You can easily spot paid vs. unpaid invoices and bills from the project’s Transactions tab, and use the Unbilled Time and Expenses report for anything not yet billed. Together, these three checkpoints give you a clear view of project cash flow.
Tip: Pair these cash flow checkpoints with your project schedule or calendar. This way, you can see whether money is moving in and out in line with your project milestones.
5. Estimates vs. Actuals Report
The Estimates vs. Actuals report helps you see how your project is performing compared to what you originally planned, so you can spot gaps early and adjust before they become costly.
What It Shows:
This report compares your estimated income and expenses for a project against what actually happened. Depending on your QuickBooks subscription, you can track this in two ways:
With budgets (available in Plus and Advanced), where you set up expected income and costs using your chart of accounts.
With project cost estimates (available in Advanced), where estimates are tied directly to the products and services you use in the project.
Why It Matters:
Projects rarely go exactly as planned. By checking actual results against your estimates, you can see whether you’re overspending, underbilling, or staying on track. This helps you make smarter decisions mid-project and improve future pricing and forecasting.
✅ Budgets are managed in the Budgeting dashboard, while project cost estimates live directly in the Projects dashboard in QuickBooks Online Advanced.
Tip: If you’re using budgets, revisit them regularly and update as needed — especially if project scope changes. If you’re in Advanced, use project cost estimates for a more detailed and real-time view of how actuals line up with your plan.
If you’re not in Advanced, budgets are still a great way to keep a pulse on project performance — just remember they live in the Budgeting dashboard, not directly in the Projects screen.
For Buildertrend users:
If you’re managing projects in Buildertrend, you can pull actual costs from QuickBooks Online directly into your Buildertrend budgets. This lets you compare estimated vs. actual costs without leaving Buildertrend, giving you a single place to monitor project financials and job progress side by side.
How to Start Using Project-Based Business Reports
If you’re not currently tracking jobs or projects in your accounting system, here’s quick summary of how to start:
Step 1: Turn on Projects in QBO
Go to Settings ⚙ > Account & Settings > Advanced > Projects and toggle it On. (Only available in QBO Plus and Advanced.)
Step 2: Create a New Project
Go to Projects in the left menu > New Project. Give it a name, select the customer it belongs to, and save. This is the “container” that will hold all related transactions.
Step 3: Assign Income & Expenses to the Project
When you create invoices, bills, expenses, or timesheets, select the correct Customer/Project in the transaction form so QBO links them.
Step 4: Track Time (Optional)
If you bill for time, turn on Time Tracking under Settings > Account & Settings > Advanced. Then log hours directly to the project.
Step 5: Run Project Reports
Go to the specific project, scroll to the Project Reports section, and choose Project Profitability, Time Cost by Employee, or other available reports.
Tip: Make it part of your monthly review process. Just like checking your P&L or Balance Sheet, you should be checking project-level profitability just as regularly.
What Project Reports Reveal That Standard Reports Don’t
While traditional reports (like the P&L or Balance Sheet) give you the overall picture, project-based business reports show the why behind the numbers.
For example:
- Your P&L says you made $15K profit this quarter.
→ Your Project Report says two jobs made $10K each, one lost $5K, and the rest broke even. - Your Balance Sheet says cash is tight.
→ Your Project Reports show that several invoices are still unpaid, highlighting exactly where cash is tied up and what’s coming in next.
These insights help you improve pricing, scheduling, and project management in ways standard financial reports simply can’t.
Don’t Have Time to Track Projects? Start Small.
If this sounds overwhelming, start with just one active project. Track time, assign costs, and run a Project Profitability Report when it wraps up.
You’ll be surprised by what you learn:
- Some projects are easier money than others
- Some services look profitable—but aren’t
- Some clients always require more time than you budget for
Over time, these insights help you refine your offers, increase margins, and build a business that works on your terms.
Want Help Setting Up Project-Based Business Reports?
If you’re not sure where to start—or you’re already using Projects in QuickBooks Online but not getting clear reports—I can help. I offer a free review to look at your setup and identify the next steps for more useful reporting.
👉 www.drivenbookkeeping.com/free-review
If you’d rather chat first to explain your needs or ask questions, you can book a free consultation here:
👉 www.drivenbookkeeping.com/calendar
Next in the Series: How to Check Business Health in 15 Minutes a Month
So far, we’ve covered what to look at and why. But what if you’re short on time? In the final post of this series, I’ll show you how to check your business health in just 15 minutes a month—no spreadsheets or stress required.
References
Intuit QuickBooks – Use reports to track your project profitability and progress
Need help?
Let’s Talk!
At Driven Bookkeeping, we empower business owners to stay organized, reduce stress, and gain a clearer understanding of their finances. Whether you’re looking for assistance with setting up automation or managing your bookkeeping, we’re here to support you every step of the way.
I look forward to meeting you.