
Top 3 Financial Reports to Run Your Business Smarter
Reports That Drive Decisions

Running your business without reviewing financial reports is like driving without a dashboard
You might get where you’re going, but you won’t know if you’re speeding, running out of gas, or heading toward a problem—until it’s too late.
Table of Contents
ToggleIf you’re like many small business owners, you may feel disconnected from your numbers. That’s not because you don’t care—it’s because no one showed you how to use financial reports as tools for clarity instead of confusing spreadsheets.
The good news? You only need three key reports to run your business smarter. Let’s break them down.
Why Financial Reports Matter (Even If You’re Not a Numbers Person)
Here’s the truth: financial reports are not just for tax season or accountants. They’re essential for making informed decisions, identifying problems early, and measuring progress—not just profit.
When you understand your key reports, you can:
- Spot cash flow issues before they become a crisis
- See whether your pricing and spending are aligned
- Know when to invest, pull back, or pivot
- Feel confident discussing your business with lenders, investors, or your CPA
The 3 Financial Reports That Actually Matter
You may see a long list of available reports in QuickBooks Online (or whichever software you use), but the vast majority aren’t relevant for your monthly check-ins.
If you’re reviewing just these three financial reports regularly, you’ll have 80% of the insight you need to run your business confidently.
But Here’s the Cost of Avoiding Reports
When business owners avoid reports, they often miss early warning signs, untapped opportunities, and insights that could prevent costly mistakes. You don’t need to be an accountant to benefit from your financials—you just need to understand what they’re trying to show you.
Before we dive into what you might be missing by skipping your reports, let’s quickly cover where to find them in QuickBooks Online. Knowing where to look is the first step to making sense of your numbers.
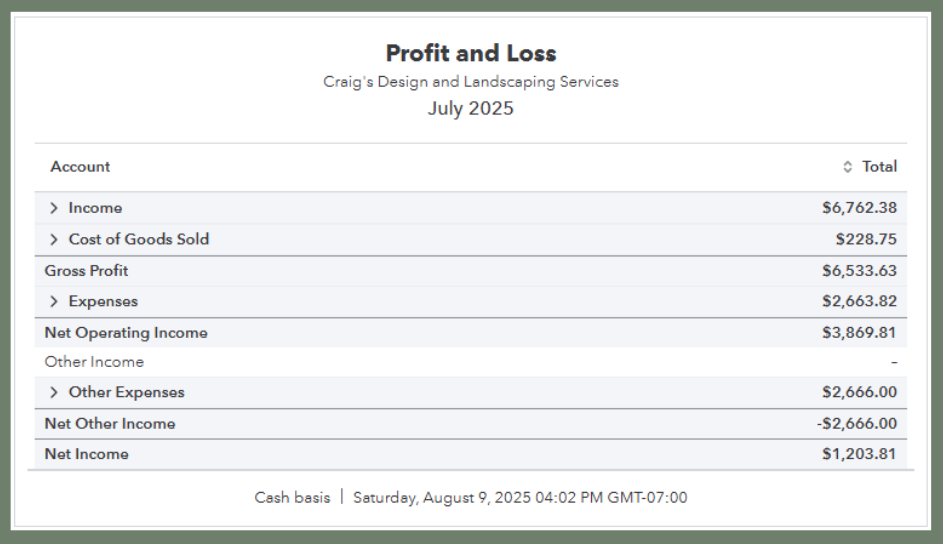
1. Profit & Loss Statement (P&L)
Also called: Income Statement
This is your go-to report for seeing if your business is making or losing money over a period of time.
What It Shows:
- Total revenue
- Cost of Goods Sold (COGS) or Direct Costs
- Gross profit
- Operating expenses (like rent, marketing, payroll)
- Net profit or loss (what’s left over after all expenses)
What to Look For:
- Trends: Compare this month vs. last month, or year-over-year
- COGS: Are they being tracked at all? Are they rising faster than revenue?
- Margins: Is your gross profit margin holding steady?
- Spending spikes: Any unusual jumps in software, advertising, or payroll?
💡 Tip: Review this report monthly. If you’re not tracking COGS properly—especially if you sell products or use inventory—you could be misreporting profit and even overpaying taxes. COGS reduce your taxable income, but only if recorded correctly.
2. Balance Sheet
This one intimidates a lot of business owners—but it shouldn’t. Once you know what to look for, it becomes one of the most powerful financial reports for understanding your business’s financial position.
What It Shows:
- What your business owns (assets)
- What your business owes (liabilities)
- What’s left for the owner (equity)
What to Look For:
- Cash balance (all accounts): Look at your total bank balances listed under Assets on the Balance Sheet—not just “Cash on Hand.” Is your overall available cash increasing, holding steady, or shrinking month to month? This trend helps you spot early cash flow issues even if your business is profitable on paper.
- Accounts receivable:
Do clients owe you money that hasn’t been collected yet? Check the Accounts Receivable line under Assets. A growing balance could mean slow-paying customers or delays in invoicing, both of which affect cash flow. - Debt:
Review any balances under Liabilities—such as credit cards, business loans, or lines of credit. Are those balances going down each month (good), or increasing (a sign to pause and reassess spending or repayment timing)? - Retained earnings:
This line shows how much profit your business has kept over time (after expenses and owner draws). If it’s growing steadily, that’s a sign your business is building financial stability. If not, it may be time to review your spending or pricing strategy.
💡 Tip: Unlike the P&L, which resets each month, the Balance Sheet is cumulative. It shows your financial health at a point in time—and whether your business is becoming stronger or shakier.
3. Cash Flow Statement
Cash is king—yet many business owners rely solely on their bank balance. The Cash Flow Statement shows how money moves in and out of your business across three categories: operations, investing, and financing.
What It Shows:
- Cash from daily operations (income and expenses)
- Cash from investments (equipment purchases, asset sales)
- Cash from financing (loans taken, repayments, owner draws)
What to Look For:
- Operating cash flow: Are you bringing in more than you spend?
- Timing gaps: Are large expenses hitting before income?
- Draws or distributions: Are you taking out more than the business can sustain?
💡 Tip: A business can be profitable and still run out of cash. This report connects the dots between your P&L and your actual bank balance.
Putting the Reports Together: A Clearer Picture
Each of these financial reports tells part of the story—but together, they help you answer bigger questions:
Question | Report to Check |
Am I profitable? | Profit & Loss |
Can I pay my bills? | Cash Flow |
Is the business healthy overall? | Balance Sheet |
Am I pricing services correctly? | P&L + COGS |
Are my margins holding up? | P&L |
Can I afford to hire? | Cash Flow + P&L |
Are customers paying on time? | Balance Sheet (A/R) |
But Wait—What About Project-Based Businesses?
Coming Soon: Special Reporting for Project-Based Businesses
If you run projects—like contracting, design, or consulting—these three core reports still apply, but they may not give you the job-level detail you need. In a later post, we’ll walk through the key reports every project-based business should be reviewing to track profitability, forecast revenue, and stay cash-positive from start to finish.
How Often Should You Review Financial Reports?
Here’s a simple rhythm I recommend for most clients:
Frequency | Report |
Monthly | P&L, Balance Sheet |
Quarterly | Cash Flow Statement |
Annually | All 3 + compare year over year |
If you’re not sure how to read them, set aside just 30 minutes a month to review your reports—or better yet, review them with your bookkeeper. With the right guidance, it becomes less about “accounting” and more about understanding your business.
Still Not Sure Where to Start?
If these financial reports still feel unfamiliar or overwhelming, that’s completely normal.
That’s why I offer a free bookkeeping review—we’ll take a look at your current reports together, talk through what’s working and what’s unclear, and outline what to focus on next. No pressure, no obligations—just clarity.
Next in the Series: Understand Your P&L Like a Pro
Now that you know the three essential reports to watch, let’s take a closer look at the one you’ll use most often: the Profit & Loss. In the next post, we’ll break down what your P&L is really telling you—and how to use it to make confident, informed decisions each month.
References
Intuit QuickBooks – Guide to Financial Statements & Free Templates
Need help?
Let’s Talk!
At Driven Bookkeeping, we empower business owners to stay organized, reduce stress, and gain a clearer understanding of their finances. Whether you’re looking for assistance with setting up automation or managing your bookkeeping, we’re here to support you every step of the way.
I look forward to meeting you.